WHAT IS MACHINE LEARNING?
Machine learning is the science of making computers learn and act like humans by feeding data and information without being explicitly defined.

MACHINE LEARNING IS OF TWO TYPES:
- SUPERVISED LEARNING
- UNSUPERVISED LEARNING
A model is able to predict with the help of labeled dataset

In supervised machine learning the algorithms teaches the machine to learn from the labeled data .
In the above diagram the known data is labeled with known response i.e either spoon or knife.The machine is trained based on the features such as height,sharpness etc.
When we enter a new data it predicts whether it is a knife or spoon based on the labeled trained data.
TYPES OF SUPERVISED LEARNING:
1. CLASSIFICATION
When the input variable is categorical i.e yes/no , true/false .We make use of classification.
TYPES OF CLASSIFICATION ALGORITHMS:
- Logistic Regression
- Naive Bayes Classifier
- Support Vector Machines
- Decision Trees
- Random Forest
- Nearest Neighbor
- Neural Network
2. REGRESSION :
Regression is used in data where a change in one variable is associated with a change in another variable.
For example consider temperature and humidity.Temperature is the independent variable and humidity is the dependent variable.As temperature increases humidity decreases.Hence they are correlated.
When we feed this data into regression model it understand the relationship between them .If we place the temperature value in the model it will be able to predict the humidity.
TYPES OF REGRESSION MODELS:
- Linear regression
- Multiple linear regression
- Polynomial linear regression
DETAILS OF CLASSIFICATION ALGORITHMS:
1.LOGISTIC REGRESSION:
Logistic regression is a statistical method for analyzing a dataset in which there are one or more independent variables that determine an outcome. The outcome is measured with a dichotomous variable (in which there are only two possible outcomes).
CONSIDER THIS EXAMPLE:

Imagine it's been a few years since you serviced your car and you want to predict when will your car break down.

The above graph is obtained when we plot the data of several car users using this classification technique.
Whers the y-axis representes the probability of breakdown and x-axis represents years.
From this graph we can predict a car will break or not.
We can observe that the blue curve is close to x-axis that means the probability of breakdown is less and as the years increases the probability of breakdown also increases.
Let us look briefly into the graph for better understanding:

The threshold valuse is calculated based on the data.
And the graph shows that after 3.5 years the car is more likely to break down.
Hence you can easily predict the data.
For math behind logistic regression visit:click here
APPLICATIONS OF LOGISTIC REGRESSION:
- IMAGE CATEGORIZATION
- HEALTH CARE(to predict the survival of a person)
2.NAIVE BAYES CLASSIFIER:
Naive Bayes classifier are a collection of classification algorithms based on Bayes Theorem .It is not a single algorithm but a family of algorithms where all of them share a common principle,i.e every pair of feature being classified is independent of each other.
Before we move ahead let us discuss about simple concepts of probability:
Lets us consider the example of tossing two coins:
The chances may be of getting Two Heads,Head and a Tail,Tail and Head,Two Tails.
- p(Getting two heads)=1/4
- p(At least one tail)=3/4
- p(Getting two heads)=1/4

Let us predict whether a person will purchase a product based on specific combination of day,discount and free delivery using Naive Bayes Classifier.

Let us consider the sample data:

Now calculate the probability for each column like number of yes and no probability for weekend,likewise for holiday ,yes and no attributes in discount and free delivery columns too.
The result will be like:
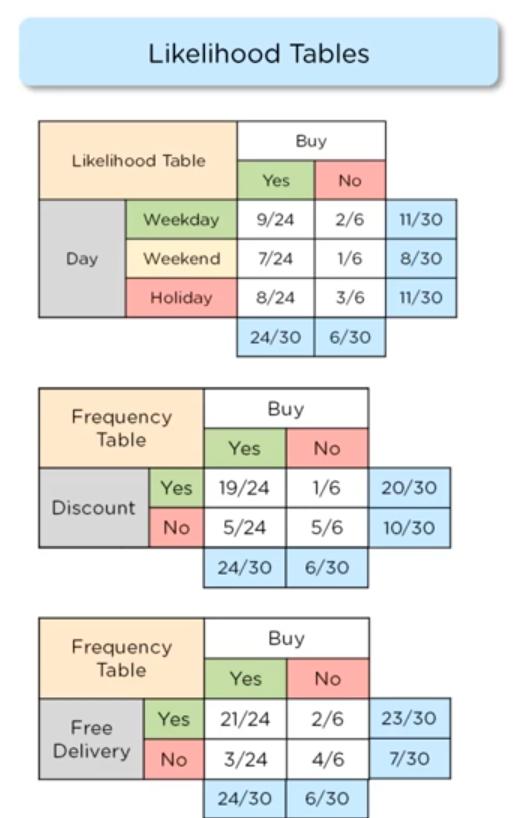
Now let us predict whether a person will buy or not if Day=holiday,Discount=yes,
Free delivery=yes
Free delivery=yes
Using the formula of naive bayes we can predict by simply placing the above values in the formula based on the conditions.
The result for person will not buy will be:
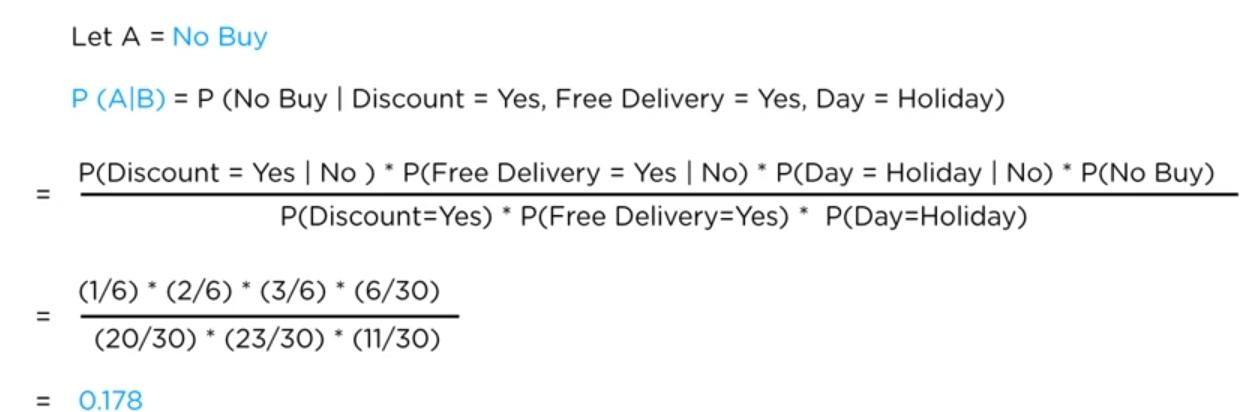
The result for person likely to buy is:

Comparing both the values person will buy the product based on our given condition as probability of person buys is greater than probabilty of person not buying the products.
APPLICATIONS OF NAIVE BAYES:
- NEWS CATEGORIZING
- EMAIL SPAM DETECTION
- FACE RECOGNITION
- SENTIMENT ANALYSIS
- DIGIT RECOGNITION
3.SUPPORT VECTOR MACHINE:
A support vector Machine is a discriminative classifier formally defined by a seperating hyperplane.In other words,given labeled training data(supervised learning),the algorithms outputs an optimal hyperplane which categorizes new examples.
EXAMPLE:
Let us consider there are set of people with different heights,weights
So what a SVM does is,it groups the people in the graph as below:
where y-axis represent height of the person and x-axis represents weight

We can divide both groups by a line.Support vector Machine follows some rules for dividing the data.
Let us divide the group by our wish without following SVM
Look at the below figure:

If we divide them like this there will be error when predicting the data.
As of the above figure the red person is a new data point and we have to predict whether the person belong to left group or right.
The groups wern't divided equally by the two lines.So the prediction can be wrong or may not be accurate
SVM follows some rules and divide the grouping like this:

SVM divides the grouping in such a way that there is maximum distance between the two dotted lines
The two points near the the dotted line are called Support Vector Points.
Hence we can easily predict the new data point.
APPLICATIONS OF SVM :
- FACE DETECTION
- TEXT AND HYPERTEXT CLASSFICATION
- HAND WRITTING RECOGNITION
4.DECISION TREES:
A decision tree is a decision support tool that uses a tree like model of decisions and their possible consequences ,including chance event outcomes,resources costs,and utility.It is one way to display an algorithm that only contains conditional control statements.Each branch of tree represents possible decision,occurrence of reaction.
We must be aware of basic terms while discussing about decision tree:
- ENTROPY: It is the measure of randomness or unpredictability in the data set.

- INFORMATION GAIN: It is the measurement of decrease in entropy after the dataset is split


Now based on the data caculate the entropy for the entire table,the result will be as follows:

Similarly calculate the Information gain of each attribute.
The one with the Highest Information gain will be the root node
In this case the Highest Information Gain is for yellow,therefore the splitting will be in such a way:
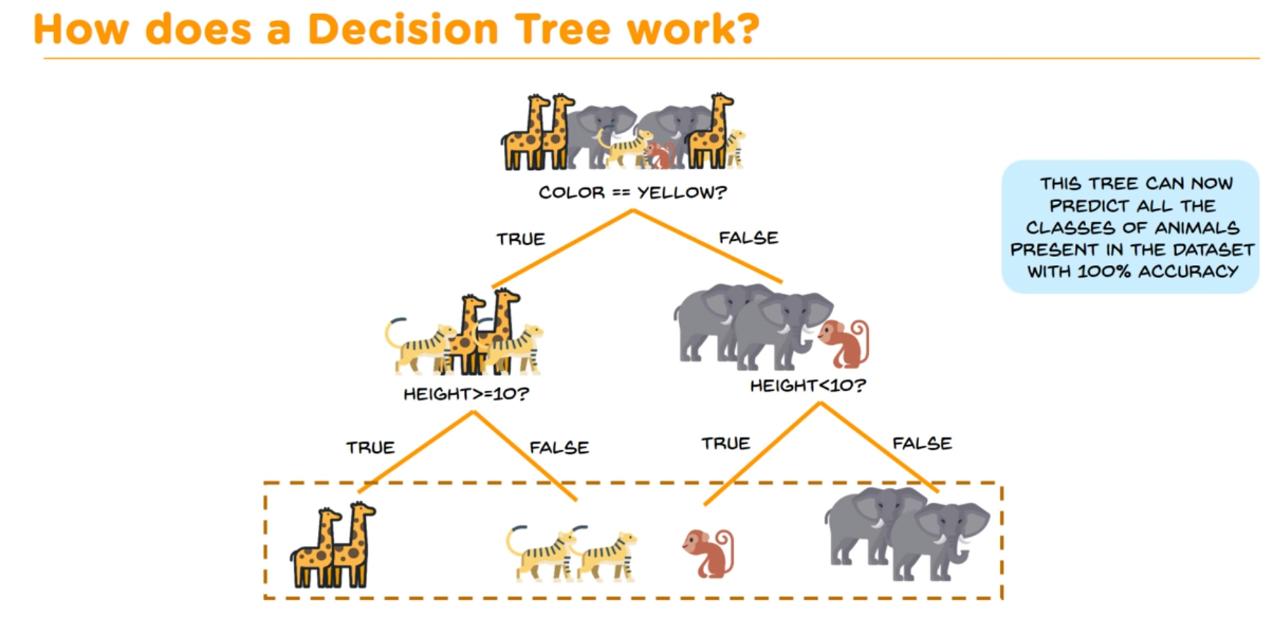
And similarly the height attribute have the second largest Information Gain in the table.
Hence second splitting is done Based on height.
APPLICATIONS OF DECISION TREES:
- CUSTOMER RELATIONSHIP MANAGEMENT
- FRAUDULENT STATEMENT DETECTION
- FAULT DIAGNOSIS
- HEALTH CARE MANAGEMENT
5.RANDOM FOREST:
Random forests or random decision forests are an ensemble learning method for classification,regression and other tasks that operates by constructing a multitude of decision trees at training time and outputting the class that is the mode of the classes or mean prediction of the individual trees.Random decision forests correct for decision trees habit of overfitting to their training sets
Training time is less.
Runs efficiently on large databases
Example:
Let us consider a data set of fruits:

Now what random forest does is,It constructs different decision trees based on differnt set of conditions. For the above data it construct trees with different root nodes such as colour=yellow, diameter>3 etc
The decision trees will be as follows:

Now if you want to predict a data , say for example you want to predict what kind of fruit is the below figure

Our decision trees will predict in such a way

The first tree predicted it as an orange
The second tree predicted it as a cherry
The third tree predicted it as an orange
As the majority of trees predicted it as ORANGE the machine will recognize it as Orange.
APPLICATIONS OF RANDOM FOREST:
- BANKING
- STOCK MARKET
- MEDICINE
- E-COMMERCE
6. K-NEAREST NEIGHBOUR:
| K nearest neighbors is a simple algorithm that stores all available cases and classifies new cases based on a similarity measure (e.g., distance functions). KNN has been used in statistical estimation and pattern recognition already in the beginning of 1970’s as a non-parametric technique. | ||
KNN must be used in noisy free data for better accuracy
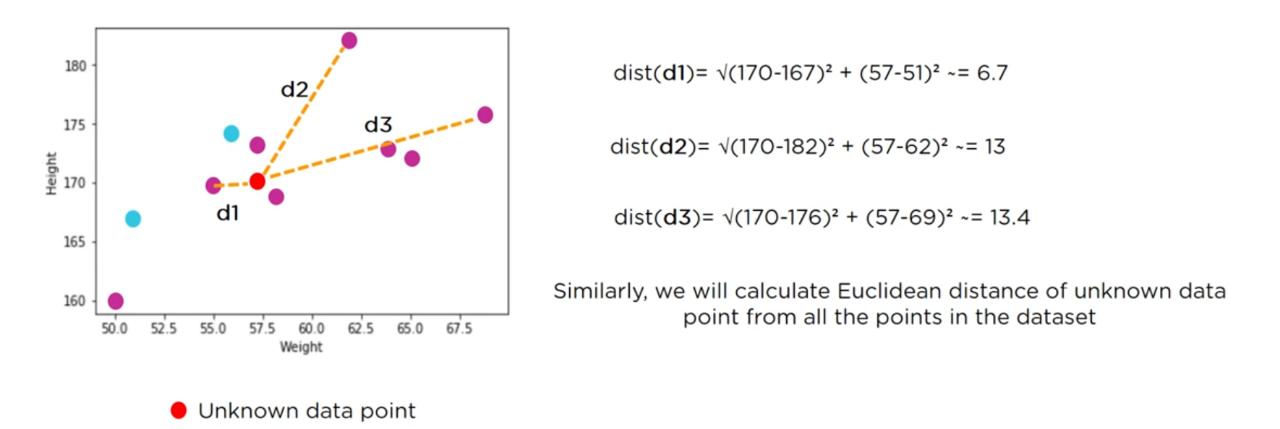
Before we discuss about Knn we must know about EUCLIDEAN DISTANCE
the formula for euclidean distance is:

Now let us consider a data set

It consists of height,weight and it says whether a person is overweight or normal.
Let us predict for the below data

We must plot all the points in a graph and calculate the euclidean distance from unknown point to the other known points as shown in below figure
How to choose value of k:

Write all the distances in tabular form

As for k=3 the last three rows represent normal condition...our data set will be predicted as normal person.
APPLICATIONS OF KNN:
- RECOMMENDATION SYSTEM
- CREDIT RATING
- LOAN MANAGEMENTS
- MONEY LAUNDERING ANALYSIS
7.NEURAL NETWORK:
Neural Networks are a class of models within the general machine learning literature. Neural networks are a specific set of algorithms that have revolutionized machine learning. They are inspired by biological neural networks and the current so-called deep neural networks have proven to work quite well. Neural Networks are themselves general function approximations, which is why they can be applied to almost any machine learning problem about learning a complex mapping from the input to the output space.
POPULAR NEURAL NETWORKS:
- FEED FORWARD NEURAL NETWORK
- RECURRENT NEURAL NETWORK
- CONVENTIONAL NEURAL NETWORK
FEED FORWARD NEURAL NETWORK:
In a Feed Forward Neural Network ,information flows only in forward direction,from the input nodes through the hidden layers and to the output nodes.
There are no cycles or loops in the network.

- DECISIONS ARE BASED ON CURRENT INPUT
- NO MEMORY ABOUT PAST
- NO FUTURE SCOPE
RECURRENT NEURAL NETWORK:
Recurrent Neural Networks are the state of the art algorithm for sequential data and among others used by Apples Siri and Googles Voice Search. This is because it is the first algorithm that remembers its input, due to an internal memory, which makes it perfectly suited for Machine Learning problems that involve sequential data

- THIS IS ADVANCEMENT FFN
- CAN HANDLE SEQUENTIAL DATA
- CONSIDERS BOTH CURRENT AND PREVIOUS INPUT
- CAN MEMORIZE PREVIOUS INPUTS
APPLICATIONS OF RNN:
- USED IN IMAGE CAPTIONING
- TIME SERIES PREDICTION
- NATURAL LANGUAGE PROCESSING
- MACHINE TRANSLATION
CNN is a feed forward neural network that is generlly used to analyze visual images by processing data with grid like topology .A CNN is also known as 'CONVNET'

LAYERS OF CNN:
- CONVOLUTION LAYER
- RELU LAYER
- POOLING LAYER
- FLATTENING
- FULLY CONNECTED LAYER
A convolution layer has a number of filters that performs convolution operation
RELU LAYER:
Real image is scanned in multiple convolution Relu layers for locating features
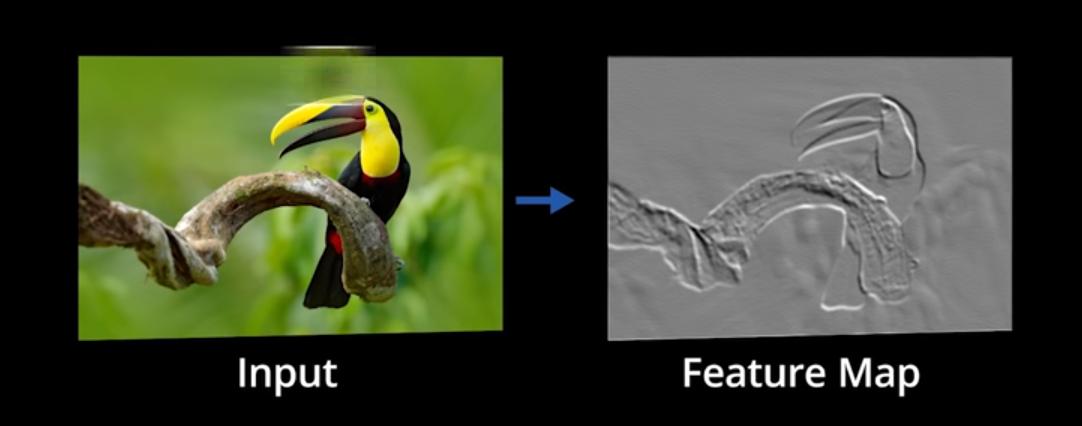
POOLING LAYER:
The feature map now goes through a pooling layer.pooling is a down sampling operation that reduces the dimensionality of feature map.

max number from each 2*2 matrix is collected and then placed in new matrix

FLATTENING:
It is the process of converting all the resultant 2 dimensional arrays from pooled feature map into a single long continous vector

FULLY CONNECTED LAYER:
The flattened matrix from the layer is fed as input to the fully connected layer to classify the image

HOW THE ENTIRE PROCESSING WORKS?

After completion of these 5 steps machine may identify an image.
APPLICATIONS OF CNN:
- FACE RECOGNITION
- SCENE LABELING
- IMAGE CLASSIFICATION
- ACTION RECOGNITION
TYPES OF UNSUPERVISED LEARNING:
1.CLUSTERING:
A clustering problem is where you want to discover the inherent groupings in the data, such as grouping customers by purchasing behavior.
EXAMPLE: K MEANS CLUSTERING
2.ASSOCIATION:
An association rule learning problem is where you want to discover rules that describe large portions of your data, such as people that buy X also tend to buy Y
EXAMPLE: APRIORI
K MEAN CLUSTERING:
K-means clustering is one of the simplest and popular unsupervised machine learning algorithms.
Typically, unsupervised algorithms make inferences from datasets using only input vectors without referring to known, or labelled, outcomes.
A cluster refers to a collection of data points aggregated together because of certain similarities.

How the K-means algorithm works:
To process the learning data,the K-means algorithm in data mining starts with a first group of randomly selected centroids, which are used as the beginning points for every cluster, and then performs iterative (repetitive) calculations to optimize the positions of the centroidsIt halts creating and optimizing clusters when either:
- The centroids are stabilized i.e there is no change in their values because the clustering has been successful.
- The defined number of iterations has been achieved.
APPLICATIONS OF K MEAN CLUSTERING:
- MOVIE RECOMMENDATION
- FRAUD DETECTION
- BANKING SECTOR
- INSURANCE COMPANY
Awesome sir
ReplyDelete